
Key facts: Beaverton
Slow rivers, long events
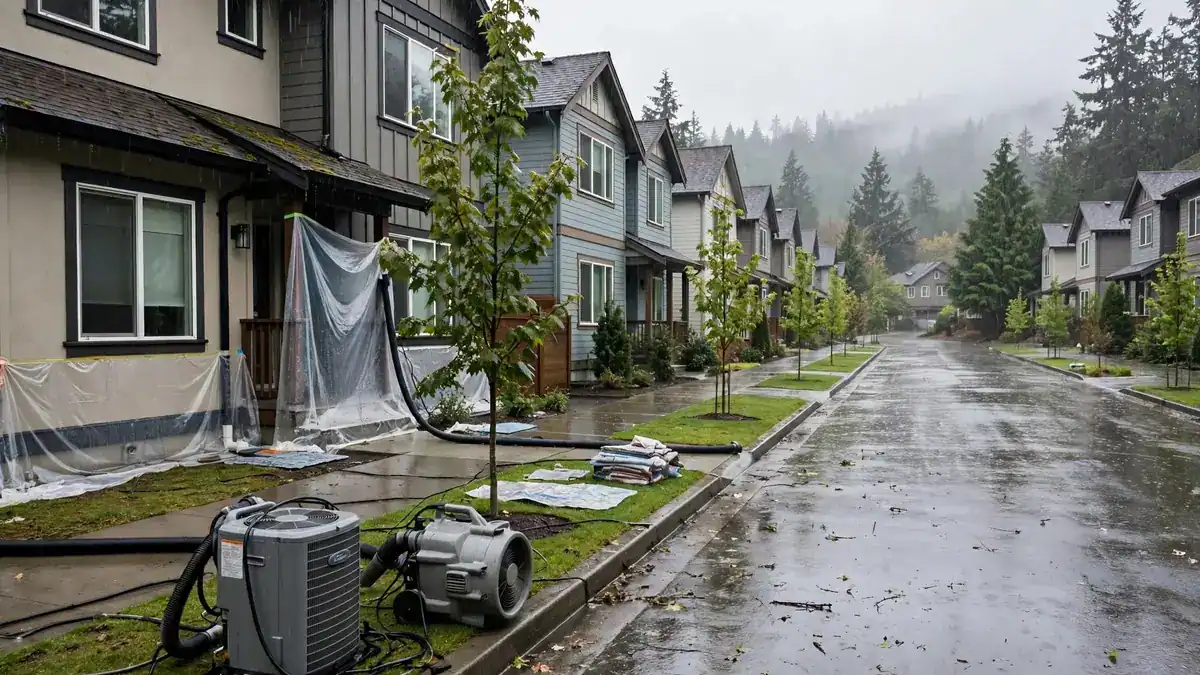
The highest recorded flow, 26,400 cubic feet per second near West Linn, came on February 10, 1996.[1] Low ground stays wet longer on a slow river. Ground near a creek may not drain for days after the rain stops.
A closer look in Beaverton
Upstairs leaks in suburban two-stories
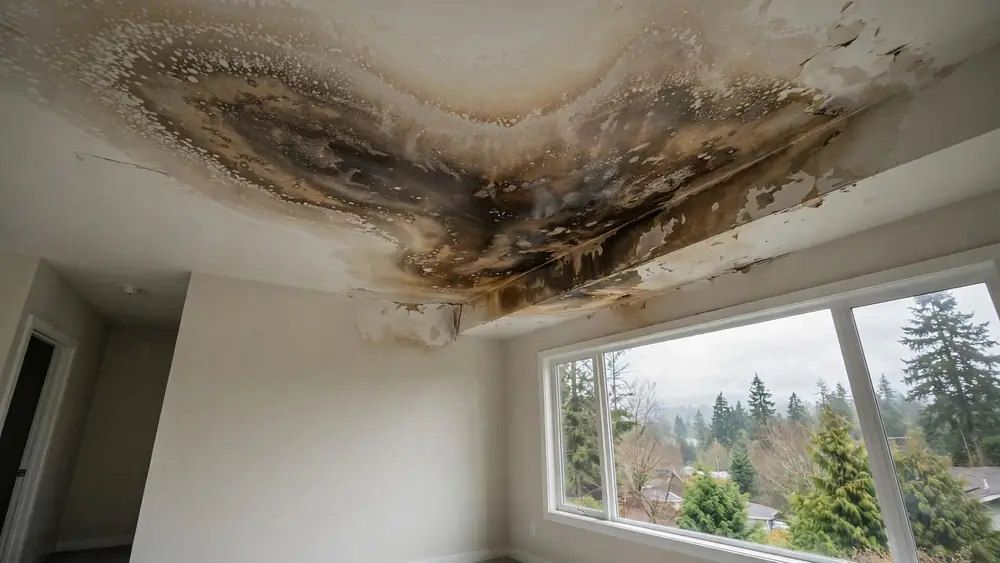
Many Beaverton homes have upstairs baths and laundries. A stain beneath one of those rooms is the usual first clue. Turn off the appliance's supply and open the ceiling only after checking for sag.
Flood claims recorded in Washington County
Beaverton sits in Washington County. FEMA publishes every National Flood Insurance Program claim with personal details removed, which gives a plain record of where water has reached insured buildings here.
| Measure | Count |
|---|---|
| Flood insurance claims on record | 408 |
| Year with the most claims | 1996 (179) |
| Largest named event | Flooding (181) |
| Claims outside high-risk A and V zones | 32% |
| Claims on buildings built before 1975 | 75% |
County-wide counts of insured claims only. Uninsured losses, burst pipes and appliance leaks are not in this data.
What the Beaverton claim record shows
For Beaverton homes, the local precedents are the events behind the most Washington County claims: Flooding (181 claims) and Winter Storm (36 claims).
About 32% of claims with a recorded zone came from outside the high-risk A and V zones, so a moderate-risk label does not mean a Beaverton home stays dry.
If your Beaverton home is older, note that buildings from before 1975 make up 75% of county claims with a known build date. Many predate current flood maps, so inspect low outlets, ductwork and subfloors closely after any water event.
Federal disaster history for Washington County
FEMA lists 17 federal declarations covering Washington County. The most common types are fire (5), severe storm (4) and flood (4). The latest are Lee Falls Fire in 2024, Wildfires and Straight-Line Winds in 2020 and Chehalem Mountain Bald Peak Fire in 2020. If your loss falls inside an open declaration, Beaverton homeowners can check DisasterAssistance.gov as well as their insurance policy.
Beaverton weather and your home
Weather records for Beaverton from 2015 through 2024 average 49 inches of precipitation a year, and December and January are the wettest months. The area averages 6.1 days a year with an inch or more.
Frost reaches Beaverton on about 34 nights a year, but hard freezes are less common, which can leave pipes in attics and outer walls poorly protected in a cold snap.
When rain falls in Beaverton
Seasonal averages for Beaverton, 2015 through 2024. Plan roof, gutter and sump pump checks before the wettest stretch.
| Season | Average | Share of year |
|---|---|---|
| January to March | 17.5 in | 36% |
| April to June | 8.5 in | 17% |
| July to September | 3.0 in | 6% |
| October to December | 19.9 in | 41% |
Modeled from Open-Meteo historical weather data. Precipitation includes rain and melted snow.
Beaverton home checklist from these records
- Don't rely on recent quiet years. Only 13% of Washington County claims date from 2015 or later, so older floods still show what can happen.
- Check roof flashing and drains before December, the wettest month in Beaverton.
- Keep dated photos of each room. After Flooding, 181 insured Washington County owners filed claims at about the same time.
What to tell the Beaverton contractor
- Whether the leak is upstairs
- Your nearest creek
- Whether a crawl space sits below
Services Beaverton callers ask about
Questions
Beaverton water damage questions
Is a ceiling stain under a bathroom urgent?
Treat it as urgent until you know the leak has stopped. Sagging means stay clear.
How wet is the Beaverton area?
Nearby Portland averages about 157 days with measurable precipitation a year.[2]